SDS-2.2, Scalable Data Science
Archived YouTube videos of this live unedited lab-lecture:
A bit about your instructor:
I, Raazesh Sainudiin or Raaz, will be your instructor for the course in data science. I have
- more than 12 years of academic research experience in applied mathematics and statistics and
- nearly 2 years of full-time experience in the data industry.
I currently (2017) have an effective joint appointment as:
- Researcher in Applied Mathematics and Statistics at Department of Mathematics, Uppsala University, Uppsala, Sweden and
- Data Science Consultant at AI and Analytics Centre of Excellence, Combient AB, Stockholm, Sweden
Quick links on Raaz's background:
The inter-faculty course in the Disciplinary Domain of Science and Technology, Uppsala University is being assisted by Tilo Wiklund and Dan Lilja.
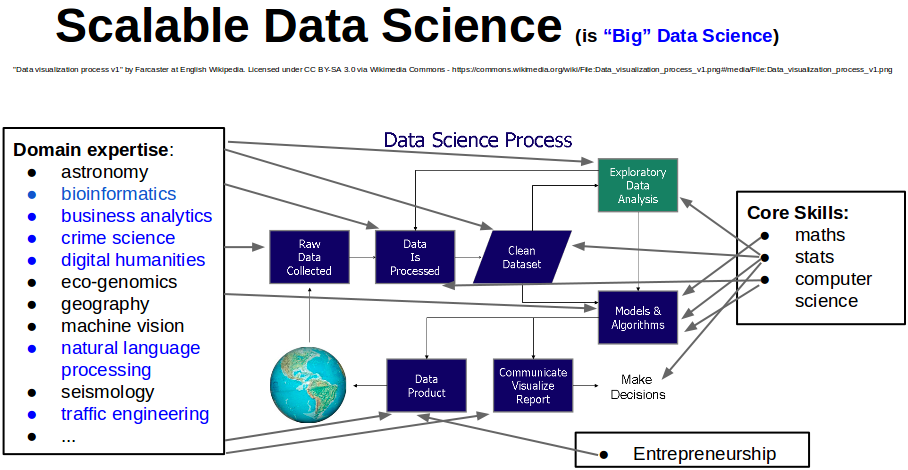
What is Scalable Data Science in one picture?

key insights
- Data Science is the study of the generalizabile extraction of knowledge from data.
- A common epistemic requirement in assessing whether new knowledge is actionable for decision making is its predictive power, not just its ability to explain the past.
- A data scientist requires an integrated skill set spanning
- mathematics,
- machine learning,
- artificial intelligence,
- statistics,
- databases, and
- optimization,
- along with a deep understanding of the craft of problem formulation to engineer effective solutions.
key insights
- ML is concerned with the building of computers that improve automatically through experience
- ML lies at the intersection of computer science and statistics and at the core of artificial intelligence and data science
- Recent progress in ML is due to:
- development of new algorithms and theory
- ongoing explosion in the availability of online data
- availability of low-cost computation (through clusters of commodity hardware in the cloud* )
- The adoption of data science and ML methods is leading to more evidence-based decision-making across:
- health sciences (neuroscience research, )
- manufacturing
- robotics (autonomous vehicle)
- vision, speech processing, natural language processing
- education
- financial modeling
- policing
- marketing
Standing on shoulders of giants!
This course will build on two other edX courses where needed.
- BerkeleyX/CS100-1x, Introduction to Big Data Using Apache Spark by Anthony A Joseph, Chancellor's Professor, UC Berkeley
- BerkeleyX/CS190-1x, Scalable Machine Learning by Ameet Talwalkar, Ass. Prof., UC Los Angeles
We encourage you to take these courses if you have more time. For those of you (including the course coordinator) who have taken these courses formally in 2015, this course will be an expanded scala version with an emphasis on individualized course project as opposed to completing labs that test sytactic skills.
We will also be borrowing more theoretical aspects from the following course:
The first two recommended readings below are (already somewhat outdated!), the third one is advanced but current now and the fourth one is in progress:
- Learning Spark : lightning-fast data analytics by Holden Karau, Andy Konwinski, Patrick Wendell, and Matei Zaharia, O'Reilly, 2015.
- Advanced analytics with Spark : patterns for learning from data at scale, Sandy Ryza, Uri Laserson, Sean Owen and Josh Wills, O'Reilly, 2015.
- High Performance Spark: Best Practices for Scaling and Optimizing Apache Spark, Holden Karau, Rachel Warren, O'Reilly, 2017.
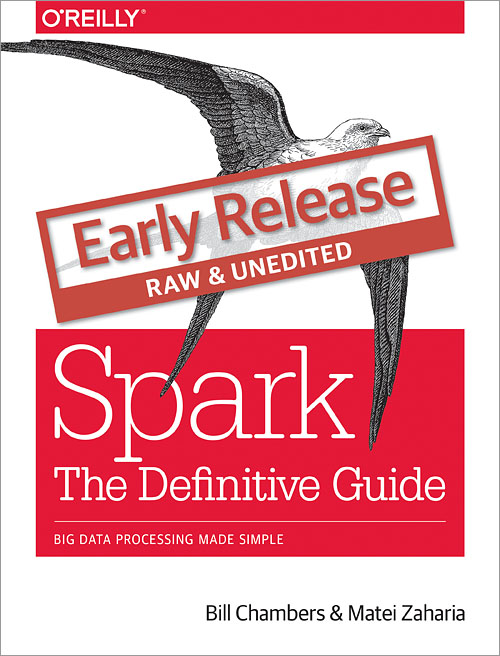
- Spark: The Definitive Guide, Big Data Processing Made Simple By Matei Zaharia, Bill Chambers, O'Reilly Media (due October 2017)

How will you be assessed?
The course is extremely hands-on and therefore gives 50% of the final grade for attending each lab and completing it. Completing a lab essentially involves going through the cells in the cloned notebooks for each week to strengthen your understanding. This will ensure that the concept as well as the syntax is understood for the learning outcomes for each week. There are additional videos and exercises you are encouraged to watch/complete. Some of the assigned exercises will be auto-graded and count towards the remaining 50% of the grade for the first course in Introduction to Data Science.
Each student taking the second course in Fundamentals of Data Science will be working on a course project and present the findings to the class in the last week or two. The course project will count towards 50% of the final grade. The project will typically involve applying Spark on a publicly available dataset or writing a report to demonstrate in-depth understanding of appropriate literature of interest to the student’s immediate research goals in academia or industry. Oral presentation of the project will constitute 10% of the grade. The remaining 40% of the grade will be for the written part of the project, which will be graded for replicability and ease of understanding. The written report will be encouraged for publication in a technical blog format in public repositories such as GitHub through a publishable mark-down'd databricks notebook (this is intended to show-case the actual skills of the student to potential employers directly). Group work on projects may be considered for complex projects.
Our Ideal Goal Publish a GitBook together (edited by Raaz, Tilo and Dan) with your co-authored course projects (note your project is a concrete protfolio you can show your potential employers!).
A Brief History of Data Analysis and Where Does "Big Data" Come From?
by Anthony Joseph in BerkeleyX/CS100.1x
- (watch now 1:53): A Brief History of Data Analysis
- (watch now 5:05): Where does Data Come From?

- SUMMARY of Some of the sources of big data.
- online click-streams (a lot of it is recorded but a tiny amount is analyzed):
- record every click
- every ad you view
- every billing event,
- every transaction, every network message, and every fault.
- User-generated content (on web and mobile devices):
- every post that you make on Facebook
- every picture sent on Instagram
- every review you write for Yelp or TripAdvisor
- every tweet you send on Twitter
- every video that you post to YouTube.
- Science (for scientific computing):
- data from various repositories for natural language processing:
- Wikipedia,
- the Library of Congress,
- twitter firehose and google ngrams and digital archives,
- data from scientific instruments/sensors/computers:
- the Large Hadron Collider (more data in a year than all the other data sources combined!)
- genome sequencing data (sequencing cost is dropping much faster than Moore's Law!)
- output of high-performance computers (super-computers) for data fusion, estimation/prediction and exploratory data analysis
- data from various repositories for natural language processing:
- Graphs are also an interesting source of big data (network science).
- social networks (collaborations, followers, fb-friends or other relationships),
- telecommunication networks,
- computer networks,
- road networks
- machine logs:
- by servers around the internet (hundreds of millions of machines out there!)
- internet of things.
- online click-streams (a lot of it is recorded but a tiny amount is analyzed):
Data Science Defined, Cloud Computing and What's Hard About Data Science?
by Anthony Joseph in BerkeleyX/CS100.1x
- (watch now 2:03): Data Science Defined
- (watch now 1:11): Cloud Computing

- In fact, if you are logged into
https://*.databricks.com/*you are computing in the cloud! - The Scalable Data Science course is supported by Databricks Academic Partners Program and the AWS Educate Grant to University of Canterbury (applied by Raaz Sainudiin in 2015).
- (watch now 3:31): What's hard about data science
(Watch later 0:52): What is Data Science? According to a Udacity Course.
What should you be able to do at the end of this course?
- by following these sessions and doing some HOMEWORK assignments.
Understand the principles of fault-tolerant scalable computing in Spark
- in-memory and generic DAG extensions of Map-reduce
- resilient distributed datasets for fault-tolerance
- skills to process today's big data using state-of-the art techniques in Apache Spark 2.2, in terms of:
- hands-on coding with real datasets
- an intuitive (non-mathematical) understanding of the ideas behind the technology and methods
- pointers to academic papers in the literature, technical blogs and video streams for you to futher your theoretical understanding.
More concretely, you will be able to:
1. Extract, Transform, Load, Interact, Explore and Analyze Data
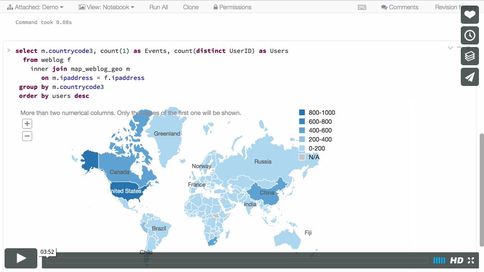
(watch later) Exploring Apache Web Logs (semi-structured data) - topic of weeks 2/3
(watch later) Exploring Wikipedia Click Streams (structured data) - topic of weeks 2/3
2. Build Scalable Machine Learning Pipelines
Apply standard learning methods via scalably servable end-to-end industrial ML pipelines
ETL, Model, Validate, Test, reETL (feature re-engineer), model validate, test,..., serve model to clients
(we will choose from this list)
- Supervised Learning Methods: Regression /Classification
- Unsupervised Learning Methods: Clustering
- Recommedation systems
- Streaming
- Graph processing
- Geospatial data-processing
- Topic modeling
- Deep Learning
- ...
(watch later) Spark Summit 2015 demo: Creating an end-to-end machine learning data pipeline with Databricks (Live Sentiment Analysis)
(watch later) Spark Summit 2017 - Expanding Apache Spark Use Cases in 2.2 and Beyond - Matei Zaharia, Tim Hunter & Michael Armbrust - Deep Learning and Structured Streaming
What Do You Really Want to Do?
Let's Break-out and Introduce each other briefly - (15-20 1-minute pitches)
What is your name, area of research/interests, and what are you interested in getting from this course? Some example answers:
I am Erik Eriksson, I am into population genomics, want to learn distributed computing frameworks for analysing genomes of entire populations for certain rare diseases.
- I am Pippi Halgrimsdottir and am into analysisng outputs of massive simulations of
- embarassingly parallel parametric simulations of interacting agents in ecology
- or chemical physics super-computer outputs?
- ...?
20 minutes of 90+10 minutes are up!
EXTRA: Databases Versus Data Science
by Anthony Joseph in BerkeleyX/CS100.1x
- (watch later 2:31): Why all the excitement about Big Data Analytics? (using google search to now-cast google flu-trends)
other interesting big data examples - recommender systems and netflix prize?
(watch later 10:41): Contrasting data science with traditional databases, ML, Scientific computing

- SUMMARY:
- traditional databases versus data science
- preciousness versus cheapness of the data
- ACID and eventual consistency, CAP theorem, ...
- interactive querying: SQL versus noSQL
- querying the past versus querying/predicting the future
- traditional scientific computing versus data science
- science-based or mechanistic models versus data-driven black-box (deep-learning) statistical models (of course both schools co-exist)
- super-computers in traditional science-based models versus cluster of commodity computers
- traditional ML versus data science
- smaller amounts of clean data in traditional ML versus massive amounts of dirty data in data science
- traditional ML researchers try to publish academic papers versus data scientists try to produce actionable intelligent systems
- (watch later 1:49): Three Approaches to Data Science
- (watch later 4:29): Performing Data Science and Preparing Data, Data Acquisition and Preparation, ETL, ...
- (watch later 2:01): Four Examples of Data Science Roles

- SUMMARY of Data Science Roles.
- individual roles:
- business person
- programmer
- organizational roles:
- enterprise
- web company
- Each role has it own unique set of:
- data sources
- Extract-Transform-Load (ETL) process
- business intelligence and analytics tools
- Most Maths/Stats/Computing programs cater to the programmer role
- Numpy and Matplotlib, R, Matlab, and Octave.
What does a Data Scientist do today and how to prepare your mind for a career in data science?
Some nice readings about data science:
- http://drewconway.com/zia/2013/3/26/the-data-science-venn-diagram
- Highly Recommended: Intro to Data Science for Academics
- "It has been a little over three years since Harvard Business Review called data science “The sexiest jobs of the 21st century” in late 2012. So far this appears a reasonable call, a few weeks ago The Economist reported that demand for data analysts has grown 372% while demand for data visualization skills (as a specialized field within data analysis) has grown 2,574%. We will likely see increasing demand for data scientist for years to come as the amount of data available for analysis and the number of automated systems in operation continue to climb. The biggest winners of the data science bonanza will be technical folks with strong communication skills and a domain of focus."
Some perspectives from current affairs
https://www.theguardian.com/politics/2017/jan/19/crisis-of-statistics-big-data-democracy
share others you find illuminating with your mates at our Meetup discussion board on Current Affairs of Interest


