// Databricks notebook source exported at Sat, 18 Jun 2016 08:46:55 UTC
Scalable Data Science
prepared by Raazesh Sainudiin and Sivanand Sivaram
supported by  and
and

The html source url of this databricks notebook and its recorded Uji  :
:
 Clickstream Analysis
Dataset: 3.2 billion requests collected during the month of February 2015 grouped by (src, dest)
Source: https://datahub.io/dataset/wikipedia-clickstream/
*This notebook requires Spark 1.6+
This notebook was originally a data analysis workflow developed with Databricks Community Edition, a free version of Databricks designed for learning Apache Spark.
Here we elucidate the original python notebook (also linked here) used in the talk by Michael Armbrust at Spark Summit East February 2016 shared from https://twitter.com/michaelarmbrust/status/699969850475737088 (watch later)
Data set
The data we are exploring in this lab is the February 2015 English Wikipedia Clickstream data, and it is available here: http://datahub.io/dataset/wikipedia-clickstream/resource/be85cc68-d1e6-4134-804a-fd36b94dbb82.
According to Wikimedia:
"The data contains counts of (referer, resource) pairs extracted from the request logs of English Wikipedia. When a client requests a resource by following a link or performing a search, the URI of the webpage that linked to the resource is included with the request in an HTTP header called the "referer". This data captures 22 million (referer, resource) pairs from a total of 3.2 billion requests collected during the month of February 2015."
The data is approximately 1.2GB and it is hosted in the following Databricks file: /databricks-datasets/wikipedia-datasets/data-001/clickstream/raw-uncompressed
Let us first understand this Wikimedia data set a bit more
Let's read the datahub-hosted link https://datahub.io/dataset/wikipedia-clickstream in the embedding below. Also click the blog by Ellery Wulczyn, Data Scientist at The Wikimedia Foundation, to better understand how the data was generated (remember to Right-Click and use -> and <- if navigating within the embedded html frame below).
//This allows easy embedding of publicly available information into any other notebook
//when viewing in git-book just ignore this block - you may have to manually chase the URL in frameIt("URL").
//Example usage:
// displayHTML(frameIt("https://en.wikipedia.org/wiki/Latent_Dirichlet_allocation#Topics_in_LDA",250))
def frameIt( u:String, h:Int ) : String = {
      """<iframe
 src=""""+ u+""""
 width="95%" height="""" + h + """"
 sandbox>
  <p>
    <a href="http://spark.apache.org/docs/latest/index.html">
      Fallback link for browsers that, unlikely, don't support frames
    </a>
  </p>
</iframe>"""
   }
displayHTML(frameIt("https://datahub.io/dataset/wikipedia-clickstream",500))
Run the next two cells for some housekeeping.
if (org.apache.spark.BuildInfo.sparkBranch < "1.6") sys.error("Attach this notebook to a cluster running Spark 1.6+")
Loading and Exploring the data
val data = sc.textFile("dbfs:///databricks-datasets/wikipedia-datasets/data-001/clickstream/raw-uncompressed")
Looking at the first few lines of the data
data.take(5).foreach(println)
data.take(2)
- The first line looks like a header
- The second line (separated from the first by ",") contains data organized according to the header, i.e.,
prev_id= 3632887,curr_id= 121", and so on.
Actually, here is the meaning of each column:
prev_id: if the referer does not correspond to an article in the main namespace of English Wikipedia, this value will be empty. Otherwise, it contains the unique MediaWiki page ID of the article corresponding to the referer i.e. the previous article the client was oncurr_id: the MediaWiki unique page ID of the article the client requestedprev_title: the result of mapping the referer URL to the fixed set of values described belowcurr_title: the title of the article the client requestedn: the number of occurrences of the (referer, resource) pairtype- "link" if the referer and request are both articles and the referer links to the request
- "redlink" if the referer is an article and links to the request, but the request is not in the production enwiki.page table
- "other" if the referer and request are both articles but the referer does not link to the request. This can happen when clients search or spoof their refer
Referers were mapped to a fixed set of values corresponding to internal traffic or external traffic from one of the top 5 global traffic sources to English Wikipedia, based on this scheme:
- an article in the main namespace of English Wikipedia -> the article title
- any Wikipedia page that is not in the main namespace of English Wikipedia ->
other-wikipedia- an empty referer ->
other-empty- a page from any other Wikimedia project ->
other-internal- Google ->
other-google- Yahoo ->
other-yahoo- Bing ->
other-bing- Facebook ->
other-facebook- Twitter ->
other-twitter- anything else ->
other-other
In the second line of the file above, we can see there were 121 clicks from Google to the Wikipedia page on "!!" (double exclamation marks). People search for everything!
- prev_id = (nothing)
- curr_id = 3632887 --> (Wikipedia page ID)
- n = 121 (People clicked from Google to this page 121 times in this month.)
- prev_title = other-google (This data record is for referals from Google.)
- curr_title = !! (This Wikipedia page is about a double exclamation mark.)
- type = other
Create a DataFrame from this CSV
- From the next Spark release - 2.0, CSV as a datasource will be part of Spark's standard release. But, we are using Spark 1.6
// Load the raw dataset stored as a CSV file
val clickstream = sqlContext.
    read.
    format("com.databricks.spark.csv").
    options(Map("header" -> "true", "delimiter" -> "\t", "mode" -> "PERMISSIVE", "inferSchema" -> "true")).
    load("dbfs:///databricks-datasets/wikipedia-datasets/data-001/clickstream/raw-uncompressed")
Print the schema
clickstream.printSchema
Display some sample data
display(clickstream)
Display is a utility provided by Databricks. If you are programming directly in Spark, use the show(numRows: Int) function of DataFrame
clickstream.show(5)
Reading from disk vs memory
The 1.2 GB Clickstream file is currently on S3, which means each time you scan through it, your Spark cluster has to read the 1.2 GB of data remotely over the network.
Call the count() action to check how many rows are in the DataFrame and to see how long it takes to read the DataFrame from S3.
clickstream.cache().count()
- It took about several minutes to read the 1.2 GB file into your Spark cluster. The file has 22.5 million rows/lines.
- Although we have called cache, remember that it is evaluated (cached) only when an action(count) is called
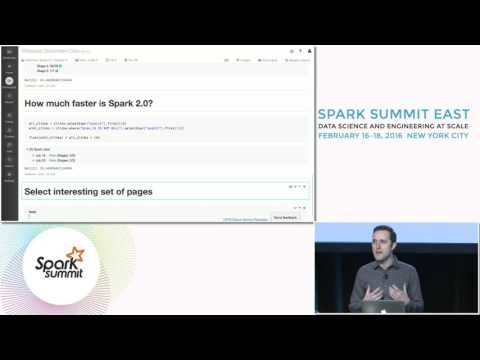
Now call count again to see how much faster it is to read from memory
clickstream.count()
- Orders of magnitude faster!
- If you are going to be using the same data source multiple times, it is better to cache it in memory
What are the top 10 articles requested?
To do this we also need to order by the sum of column n, in descending order.
//Type in your answer here...
display(clickstream
  .select(clickstream("curr_title"), clickstream("n"))
  .groupBy("curr_title")
  .sum()
  .orderBy($"sum(n)".desc)
  .limit(10))
Who sent the most traffic to Wikipedia in Feb 2015?
In other words, who were the top referers to Wikipedia?
display(clickstream
  .select(clickstream("prev_title"), clickstream("n"))
  .groupBy("prev_title")
  .sum()
  .orderBy($"sum(n)".desc)
  .limit(10))
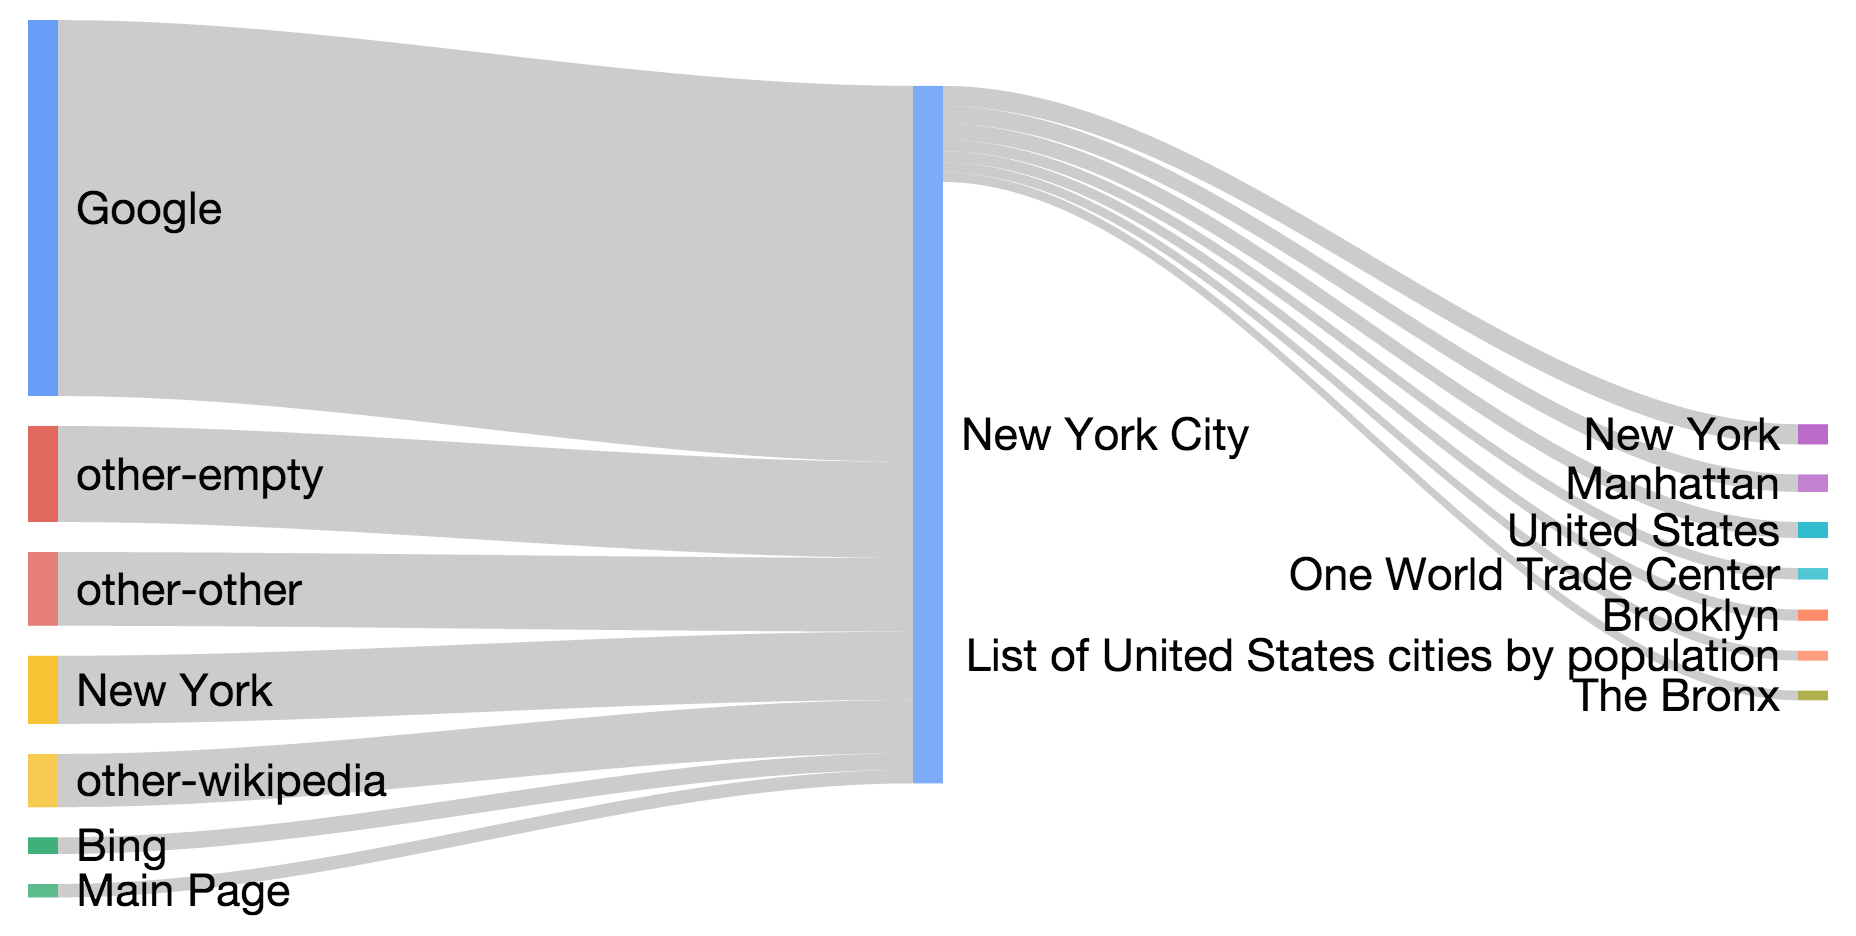
As expected, the top referer by a large margin is Google. Next comes refererless traffic (usually clients using HTTPS). The third largest sender of traffic to English Wikipedia are Wikipedia pages that are not in the main namespace (ns = 0) of English Wikipedia. Learn about the Wikipedia namespaces here: https://en.wikipedia.org/wiki/Wikipedia:Project_namespace
Also, note that Twitter sends 10x more requests to Wikipedia than Facebook.
What were the top 5 trending articles people from Twitter were looking up in Wikipedia?
//Type in your answer here...
display(clickstream
  .select(clickstream("curr_title"), clickstream("prev_title"), clickstream("n"))
  .filter("prev_title = 'other-twitter'")
  .groupBy("curr_title")
  .sum()
  .orderBy($"sum(n)".desc)
  .limit(5))
What percentage of page visits in Wikipedia are from other pages in Wikipedia itself?
val allClicks = clickstream.selectExpr("sum(n)").first.getLong(0)
val referals = clickstream.
                filter(clickstream("prev_id").isNotNull).
                selectExpr("sum(n)").first.getLong(0)
(referals * 100.0) / allClicks
Register the DataFrame to perform more complex queries
clickstream.registerTempTable("clicks")
Which Wikipedia pages have the most referrals to the Donald Trump page?
%sql
SELECT *
FROM clicks
WHERE
  curr_title = 'Donald_Trump' AND
  prev_id IS NOT NULL AND prev_title != 'Main_Page'
ORDER BY n DESC
LIMIT 20
Top referrers to all presidential candidate pages
%sql
SELECT
      prev_title,
      curr_title,
      n
    FROM clicks
    WHERE
      curr_title IN ('Donald_Trump', 'Bernie_Sanders', 'Hillary_Rodham_Clinton', 'Ted_Cruz') AND
      prev_id IS NOT NULL AND prev_title != 'Main_Page'
    ORDER BY n DESC
    LIMIT 20
Load a visualization library
This code is copied after doing a live google search (by Michael Armbrust at Spark Summit East February 2016 shared from https://twitter.com/michaelarmbrust/status/699969850475737088).
package d3
// We use a package object so that we can define top level classes like Edge that need to be used in other cells
import org.apache.spark.sql._
import com.databricks.backend.daemon.driver.EnhancedRDDFunctions.displayHTML
case class Edge(src: String, dest: String, count: Long)
case class Node(name: String)
case class Link(source: Int, target: Int, value: Long)
case class Graph(nodes: Seq[Node], links: Seq[Link])
object graphs {
val sqlContext = SQLContext.getOrCreate(org.apache.spark.SparkContext.getOrCreate())
import sqlContext.implicits._
def force(clicks: Dataset[Edge], height: Int = 100, width: Int = 960): Unit = {
val data = clicks.collect()
val nodes = (data.map(_.src) ++ data.map(_.dest)).map(_.replaceAll("_", " ")).toSet.toSeq.map(Node)
val links = data.map { t =>
Link(nodes.indexWhere(_.name == t.src.replaceAll("_", " ")), nodes.indexWhere(_.name == t.dest.replaceAll("_", " ")), t.count / 20 + 1)
}
showGraph(height, width, Seq(Graph(nodes, links)).toDF().toJSON.first())
}
/**
* Displays a force directed graph using d3
* input: {"nodes": [{"name": "..."}], "links": [{"source": 1, "target": 2, "value": 0}]}
*/
def showGraph(height: Int, width: Int, graph: String): Unit = {
displayHTML(s"""
<!DOCTYPE html>
<html>
<head>
<meta http-equiv="Content-Type" content="text/html; charset=UTF-8">
<title>Polish Books Themes - an Interactive Map</title>
<meta charset="utf-8">
<style>
.node_circle {
stroke: #777;
stroke-width: 1.3px;
}
.node_label {
pointer-events: none;
}
.link {
stroke: #777;
stroke-opacity: .2;
}
.node_count {
stroke: #777;
stroke-width: 1.0px;
fill: #999;
}
text.legend {
font-family: Verdana;
font-size: 13px;
fill: #000;
}
.node text {
font-family: "Helvetica Neue","Helvetica","Arial",sans-serif;
font-size: 17px;
font-weight: 200;
}
</style>
</head>
<body>
<script src="//d3js.org/d3.v3.min.js"></script>
<script>
var graph = $graph;
var width = $width,
height = $height;
var color = d3.scale.category20();
var force = d3.layout.force()
.charge(-700)
.linkDistance(180)
.size([width, height]);
var svg = d3.select("body").append("svg")
.attr("width", width)
.attr("height", height);
force
.nodes(graph.nodes)
.links(graph.links)
.start();
var link = svg.selectAll(".link")
.data(graph.links)
.enter().append("line")
.attr("class", "link")
.style("stroke-width", function(d) { return Math.sqrt(d.value); });
var node = svg.selectAll(".node")
.data(graph.nodes)
.enter().append("g")
.attr("class", "node")
.call(force.drag);
node.append("circle")
.attr("r", 10)
.style("fill", function (d) {
if (d.name.startsWith("other")) { return color(1); } else { return color(2); };
})
node.append("text")
.attr("dx", 10)
.attr("dy", ".35em")
.text(function(d) { return d.name });
//Now we are giving the SVGs co-ordinates - the force layout is generating the co-ordinates which this code is using to update the attributes of the SVG elements
force.on("tick", function () {
link.attr("x1", function (d) {
return d.source.x;
})
.attr("y1", function (d) {
return d.source.y;
})
.attr("x2", function (d) {
return d.target.x;
})
.attr("y2", function (d) {
return d.target.y;
});
d3.selectAll("circle").attr("cx", function (d) {
return d.x;
})
.attr("cy", function (d) {
return d.y;
});
d3.selectAll("text").attr("x", function (d) {
return d.x;
})
.attr("y", function (d) {
return d.y;
});
});
</script>
</html>
""")
}
def help() = {
displayHTML("""
<p>
Produces a force-directed graph given a collection of edges of the following form:</br>
<tt><font color="#a71d5d">case class</font> <font color="#795da3">Edge</font>(<font color="#ed6a43">src</font>: <font color="#a71d5d">String</font>, <font color="#ed6a43">dest</font>: <font color="#a71d5d">String</font>, <font color="#ed6a43">count</font>: <font color="#a71d5d">Long</font>)</tt>
</p>
<p>Usage:<br/>
<tt><font color="#a71d5d">import</font> <font color="#ed6a43">d3._</font></tt><br/>
<tt><font color="#795da3">graphs.force</font>(</br>
<font color="#ed6a43">height</font> = <font color="#795da3">500</font>,<br/>
<font color="#ed6a43">width</font> = <font color="#795da3">500</font>,<br/>
<font color="#ed6a43">clicks</font>: <font color="#795da3">Dataset</font>[<font color="#795da3">Edge</font>])</tt>
</p>""")
}
}
d3.graphs.help()
d3.graphs.force(
  height = 800,
  width = 1000,
  clicks = sql("""
    SELECT
      prev_title AS src,
      curr_title AS dest,
      n AS count FROM clicks
    WHERE
      curr_title IN ('Donald_Trump', 'Bernie_Sanders', 'Hillary_Rodham_Clinton', 'Ted_Cruz') AND
      prev_id IS NOT NULL AND prev_title != 'Main_Page'
    ORDER BY n DESC
    LIMIT 20""").as[d3.Edge])
Convert raw data to parquet
Apache Parquet is a columnar storage format available to any project in the Hadoop ecosystem, regardless of the choice of data processing framework, data model or programming language. It is a more efficient way to store data frames.
- To understand the ideas read Dremel: Interactive Analysis of Web-Scale Datasets, Sergey Melnik, Andrey Gubarev, Jing Jing Long, Geoffrey Romer, Shiva Shivakumar, Matt Tolton and Theo Vassilakis,Proc. of the 36th Int'l Conf on Very Large Data Bases (2010), pp. 330-339, whose Abstract is as follows:
- Dremel is a scalable, interactive ad-hoc query system for analysis of read-only nested data. By combining multi-level execution trees and columnar data layouts it is capable of running aggregation queries over trillion-row tables in seconds. The system scales to thousands of CPUs and petabytes of data, and has thousands of users at Google. In this paper, we describe the architecture and implementation of Dremel, and explain how it complements MapReduce-based computing. We present a novel columnar storage representation for nested records and discuss experiments on few-thousand node instances of the system.
displayHTML(frameIt("https://parquet.apache.org/documentation/latest/",350))
// Convert the DatFrame to a more efficent format to speed up our analysis
clickstream.
  write.
  mode(SaveMode.Overwrite).
  parquet("/datasets/wiki-clickstream") // warnings are harmless
Load parquet file efficiently and quickly into a DataFrame
Now we can simply load from this parquet file next time instead of creating the RDD from the text file (much slower).
Also using parquet files to store DataFrames allows us to go between languages quickly in a a scalable manner.
val clicks = sqlContext.read.parquet("/datasets/wiki-clickstream")
clicks.printSchema
display(clicks) // let's display this DataFrame
DataFrame in python
%py
clicksPy = sqlContext.read.parquet("/datasets/wiki-clickstream")
%py
clicksPy.show()
Now you can continue from the original python notebook also linked to this shard from here (/#workspace/scalable-data-science/xtraResources/sparkSummitEast2016/Wikipedia Clickstream Data).
Recall from the beginning of this notebook that this python databricks notebook was used in the talk by Michael Armbrust at Spark Summit East February 2016 shared from https://twitter.com/michaelarmbrust/status/699969850475737088
(watch now, if you haven't already!)
You Try!
Try to load a DataFrame in R from the parquet file just as we did for python.
%r
Scalable Data Science
prepared by Raazesh Sainudiin and Sivanand Sivaram
supported by
and